Compare Organic Queries Between Two Date Ranges
Compare clicks, impressions, CTR and positions across exports.
How Do You Compare Organic Search Queries Between Two Date Ranges?
In Google Search Console, open Performance > Search results, keep the property, search type, and filters consistent, and compare two equivalent date ranges. Export the Queries data for each period, match rows by query, then compare clicks, impressions, and click-through rate (CTR). Evaluate average position separately rather than averaging query rankings together. This reveals which visible search terms gained or lost traffic without confusing shifts in search demand with ranking changes.
Search Console CSV Comparison Analyzer
Compare clicks, impressions, CTR and positions across exports.
Compare Search Console CSV exports
Upload UTF-8 CSV exports with Clicks, Impressions, CTR and Position columns. The two exports must contain compatible dimensions. Totals are calculated from supplied rows only; average position is weighted by impressions. No file is uploaded to the website.
Compare Search Console Query Performance Without Misreading the Numbers
A list of your highest-traffic keywords tells you what worked during one period. A two-date-range comparison tells you what changed: which queries attracted more clicks, which lost impressions, and where click-through rate moved even though visibility stayed similar. These differences can guide your next content update, but only if the report settings and calculations are consistent.
This guide uses Google Search Console’s own Performance report as the source of truth and explains how to analyze two exported query tables. You will see a worked example, formulas you can verify in a spreadsheet, rules for interpreting average position, and the data limitations that make apparent “new” or “lost” keywords less certain than they look.
Choose Dates That Answer the Right Question
Before exporting anything, decide whether you are investigating a recent change, a seasonal trend, or the effect of a site update. Equal-length periods are usually the cleanest starting point. Comparing 28 days with the previous 28 days also lines up weekdays, reducing distortion from different numbers of weekends.
For a website with strong seasonality, a year-over-year comparison may be more informative than the immediately preceding month. Google Search Console lets you compare date periods directly in the Performance report; use its built-in comparison first to confirm that the overall trend exists. Avoid including preliminary or incomplete recent data when you need a stable conclusion.
Keep the same Search Console property, search type (such as Web), country, device, and page or query filters across both periods. A desktop-only report and an all-devices report do not measure the same population.
Export the Two Query Tables From Search Console
- Open Performance > Search results in the correct verified property.
- Choose a completed first date range, such as 1–28 September 2026. Set the intended search type and other filters.
- Select the Queries tab and use Export to download the current report as CSV. Keep the query table and record the report settings.
- Change only the dates to the second range, such as 29 September–26 October 2026, and export again.
- Keep descriptive filenames such as
gsc-queries-period-a.csvandgsc-queries-period-b.csv, along with a note of the property, date ranges, and filters. - Review the two files’ column names before comparing. If your export format or filters differ, fix that inconsistency first.
Google also offers a Date > Compare option inside the Performance report. That is often sufficient for a quick diagnosis. Separate query exports become more useful when you want to annotate findings, prioritize changes, or retain a repeatable CSV comparison.
The Search Console CSV Comparison Analyzer is the relevant SEOToolCheckers tool for this workflow. Check the input instructions displayed by the tool before uploading files; the exact accepted CSV layout and processing behavior must be confirmed in the current installed version.
Join Queries Without Losing Rows That Appear in Only One Period
Match the same query text from period A and period B. Use a full outer join, or the spreadsheet equivalent, so queries appearing in only one export are retained instead of disappearing from the comparison.
Preserve the original query strings and keep a note of any cleaning rule you apply. Automatically combining singulars, plurals, synonyms, or differently worded searches can hide meaningful differences in intent. If the exports contain duplicated labels caused by a changed report dimension, investigate that before adding the values together.
Important: a query that is absent from an export is not necessarily a query with zero Google impressions. It might be anonymized, outside the exported row limit, or excluded by the current filters. Label it “not present in export” until there is independent evidence that it truly received no activity.
Calculate Click, Impression, and CTR Changes Correctly
For queries with reliable figures in both periods, use these comparisons:
- Click difference: period B clicks − period A clicks.
- Impression difference: period B impressions − period A impressions.
- Percentage change: (period B − period A) ÷ period A × 100, only when the period A value is nonzero.
- CTR for a period: clicks ÷ impressions × 100, when impressions are greater than zero.
- CTR change: period B CTR − period A CTR, expressed in percentage points, not as a plain percent change.
Suppose a query’s CTR rises from 2.50% to 2.87%. That is a gain of approximately 0.37 percentage points. Calling it a 0.37% increase is incorrect; a relative percentage increase would use the old CTR as the denominator instead. Do not divide by zero for queries lacking a valid baseline.
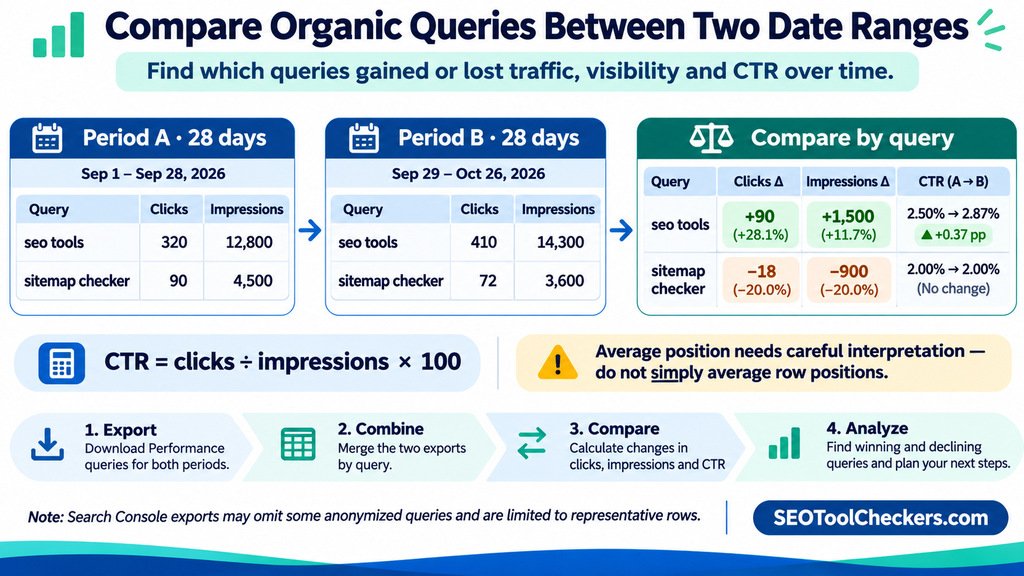
Worked Example: Two Queries Across Equal 28-Day Windows
These invented example figures show how to read a comparison table. They are not site traffic data or results from running the analyzer.
| Query | Period A clicks / impressions | Period B clicks / impressions | Click change | CTR change |
|---|---|---|---|---|
| seo tools | 320 / 12,800 | 410 / 14,300 | +90 (+28.1%) | 2.50% → 2.87% (+0.37 pp) |
| sitemap checker | 90 / 4,500 | 72 / 3,600 | −18 (−20.0%) | 2.00% → 2.00% (no change) |
In the first row, impressions and clicks both rose, and CTR improved slightly. That does not prove rankings increased: query demand, search features, and the results mix may also have changed. In the second row, clicks declined by 20%, but CTR stayed steady. The immediate question is why impressions fell, not whether the snippet suddenly became less appealing.
Why Average Position Needs Special Handling
Search Console’s average position summarizes positions where your property appeared, with the reported figure based on impressions and the topmost result for that property or grouping. It is not a fixed rank for a keyword, and it can vary with search location, device, date, and the set of impressions.
Do not compute a site’s overall position by taking the simple arithmetic average of exported query positions. A query with ten impressions should not carry the same weight as one with ten thousand. Likewise, avoid averaging the reported positions of two periods as if they were two equally sized observations. When you need a pooled figure, use appropriately impression-weighted data from a consistent aggregation; for a basic editorial review, it is usually clearer to keep each period’s reported position separate.
When comparing the same query, a movement from position 8 to position 5 means the numeric average position improved by three places. It still does not prove that every searcher saw your page three places higher. Treat position changes as context for interpreting clicks and impressions, not the only success measure.
Read the Pattern Before Deciding What to Fix
| Observed change | What it may indicate | What to check next |
|---|---|---|
| Clicks and impressions rise together | More demand or more search visibility | Check page mix, query intent, and average position. |
| Clicks fall, impressions remain similar | Lower CTR or changed search presentation | Review CTR, search appearance, snippet relevance, and devices. |
| Impressions fall, CTR stays steady | Lower measured exposure, possibly demand-related | Compare seasonal history, countries, pages, and query mix. |
| Average position worsens, clicks stay stable | Changing impression mix or offsetting CTR/demand changes | Check individual queries and page-level data before concluding. |
| Query appears in only one CSV | New visibility or export/reporting omission | Confirm filters, row limits, and available historical records. |
Prefer meaningful absolute changes to dramatic percentages on tiny baselines. A rise from one click to four is 300%, but three additional clicks may not deserve more attention than a decline of 150 clicks for a core service query.
Separate Branded Terms, Intent Changes, and Competing Pages
A website-wide change can be concentrated in branded searches, informational questions, or a small group of commercial terms. Build segments before treating every decline as one problem. The Search Console Regex Builder and Tester is useful for preparing patterns that identify related query phrases inside Search Console. Keep the same segment definition in both periods.
Then examine the Pages dimension for an important query. If a different URL is receiving its impressions, investigate the intended search intent, canonical signals, and internal linking. The Keyword Cannibalization Analyzer is a related diagnostic aid, but multiple URLs appearing for one query do not automatically mean harmful cannibalization.
For larger query lists, map the strongest topic groups to existing URLs with the Keyword-to-Page Mapping Tool. That turns a change report into an improvement plan instead of a list of keywords to repeat in the copy.
What Two CSV Exports Cannot Tell You
Search Console exports are valuable, but they are not a complete census of Google searches. Standard report exports may contain only up to 1,000 representative rows; totals in the report can include rows that did not appear in the exported table. Some uncommon queries are anonymized for privacy. Therefore, adding the visible query rows may not reproduce the property-level chart total.
Other limits matter too. Query-level results can differ from page-level totals because of aggregation rules. Search Console clicks are not identical to Google Analytics sessions, and the Performance report covers Google Search reporting rather than all website traffic. Neither the comparison table nor a tool that reads it can prove the exact cause of a ranking change.
If more extensive reporting is needed, the Search Console API and bulk exports offer additional options, but they also have constraints. Keep the source, filters, and collection method attached to every analysis so your conclusions remain auditable.
Common Questions About Search Console Date Comparisons
Can I compare two dates directly inside Google Search Console?
Yes. In the Search results Performance report, edit the Date filter, choose Compare, select your periods, and apply the comparison. Export separate periods if you want to work with two independent query tables.
Why don’t the exported query totals match the Performance chart?
Google may omit anonymized query text and limit the visible/exported rows, while the chart can include additional activity. Page-level and property-level aggregation can also produce different totals.
Official Search Console References
For current behavior, consult Google’s Performance report overview, comparison and filtering guidance, export documentation, and position and impression definitions.